
Spend Analytics That Tie Inventory Decisions Back to Cost
CoreNexis makes it easier to understand how reagent purchasing patterns evolve over time so laboratory leaders can connect operational decisions to spend behavior, category trends, and supplier impact.
The Challenge
Laboratory reagent spending tends to be one of those line items that grows steadily without anyone having a clear picture of why. Individual purchases make sense in isolation. A reagent is needed, an order is placed. But over time, spending patterns drift. Preferred suppliers change, consumption increases, and nobody can say with confidence whether the lab is spending more because it is doing more work or because purchasing habits have shifted. Finance asks questions that lab managers cannot answer without hours of spreadsheet archaeology.
How Spend Analytics Works
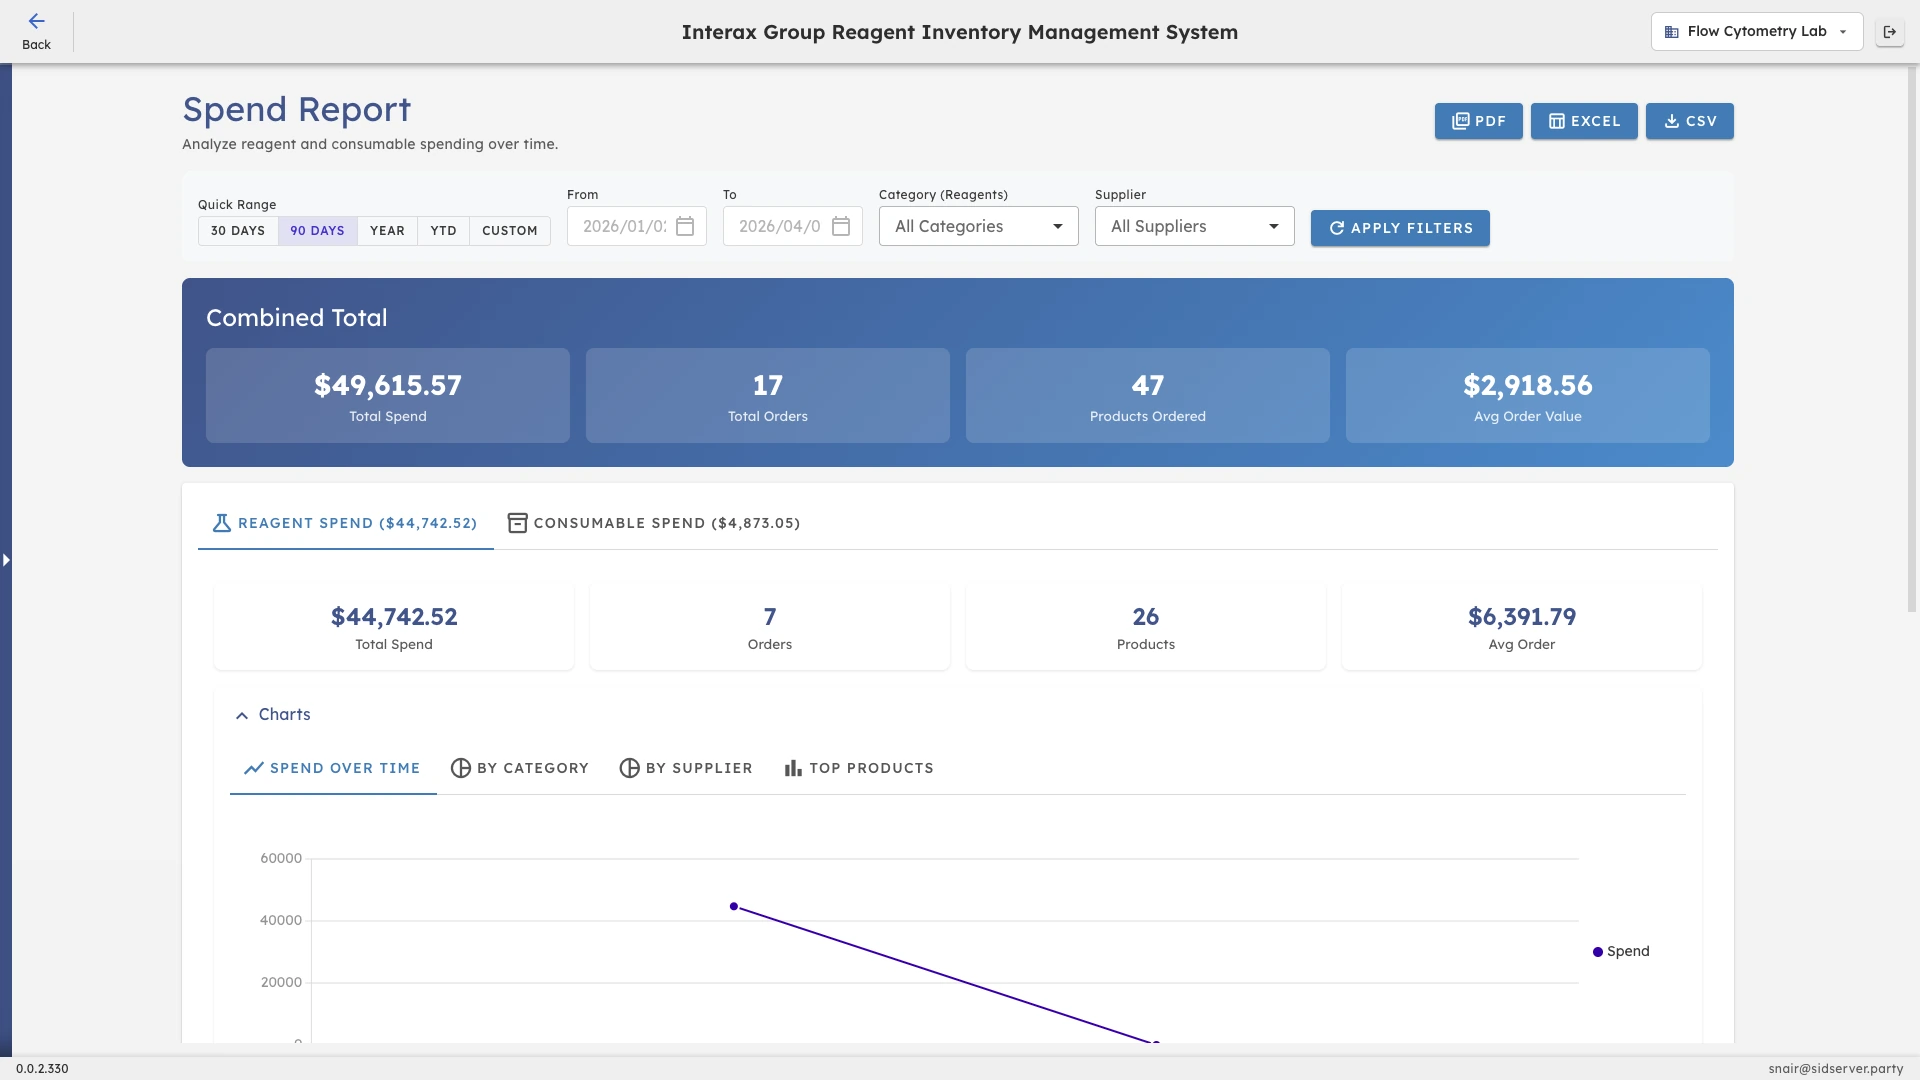
Trend-based spend views
CoreNexis tracks reagent spending over time, not just as one-off snapshots. Monthly, quarterly, and annual spend views make it possible to see where costs are increasing, where they have stabilized, and where efficiency gains might be realistic. This historical perspective is what turns a cost conversation from 'we spent X this quarter' into 'spending in this category has increased 15% over the last three quarters, and here is what is driving it.'
Category and supplier analysis
Spending data in CoreNexis can be broken down by reagent category, individual supplier, or purchasing pattern. This supports more informed procurement discussions, whether the goal is consolidating suppliers, renegotiating pricing, or understanding why a particular category is consuming a disproportionate share of the budget. The breakdowns are available without manual data assembly.
Operational context for cost
Spend analytics in CoreNexis are connected to the same operational data that drives the rest of the system: usage rates, order frequency, stock levels, and verification activity. This means cost trends can be understood in the context of what is actually happening in the lab, not in isolation. When spending increases, teams can see whether it correlates with higher testing volume, wastage from expired stock, or changes in supplier pricing.
What Changes
- Identify where spend is increasing and where efficiency gains are possible.
- Support more informed conversations with finance, procurement, and lab leadership.
- Connect operational inventory behavior to actual cost patterns over time.
See Spend Analytics in your lab's context
We can walk through the workflows, reporting, and operational controls most relevant to your environment.